-
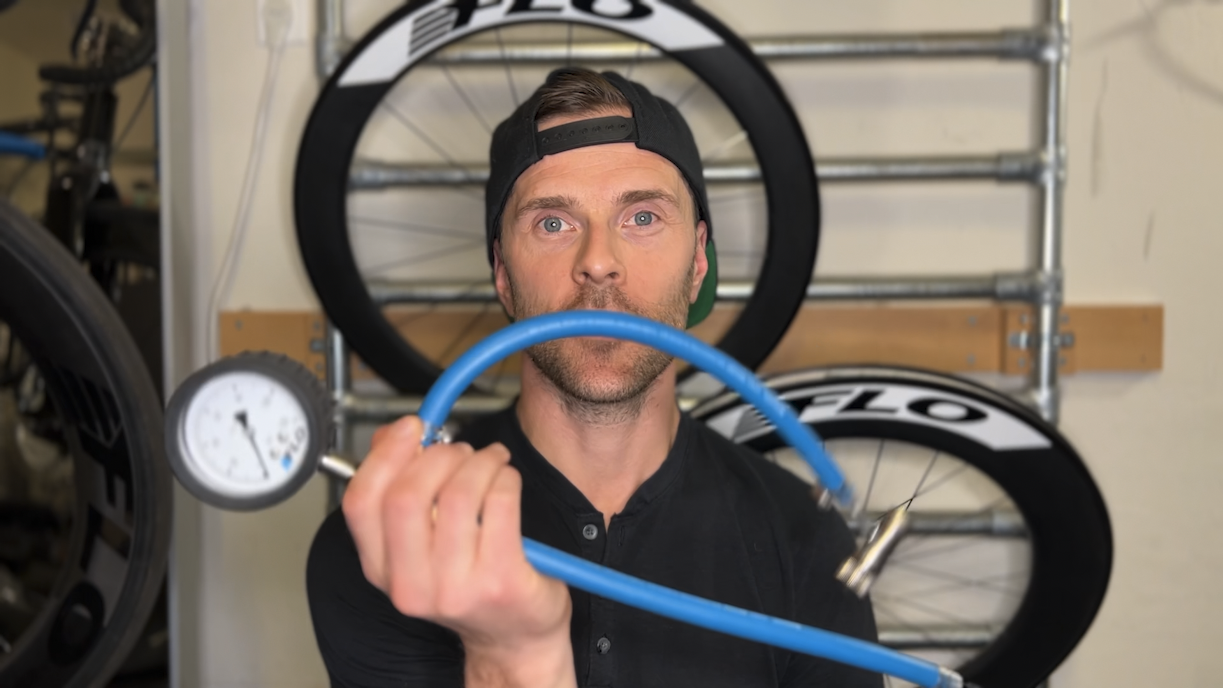
Tire Pressure Temperature Calculator
Lately, I’ve presented a number of webinars on Cycling Efficiency to cycling teams and how temperature change impacts tire pressure is a large discussion topic. I can’t tell you how many times I’ve walked by T2 in Kona only to hear tires popping mid-day after the sun comes up. Why is that happening? Tire pressure…
-
Rolling Out of 2023 and Into 2024
New Product Launches In 2024 FLO turns 12. That’s hard to believe in many ways. 2023 was a big year for FLO. We released nine (9) new products which was a massive undertaking. Those new products are listed below. FLO Air GaugeFLO Locking ChuckFLO Mini PumpFLO Aid BagFLO Saddle BagFLO CO2 RegulatorFLO Tire LeversFLO Hex…
-

Canadian Pre-Order
We’re testing the market and bringing FLO to our roots. If you’re a Canadian resident you can now pre-order FLO wheels and avoid import tax/duty! WHAT YOU NEED TO KNOW HOW TO SECURE YOUR PRE-ORDER We’re very excited to have the ability to ship import tax/duty free within Canada now. If this pre-order response is strong, we plan…
-
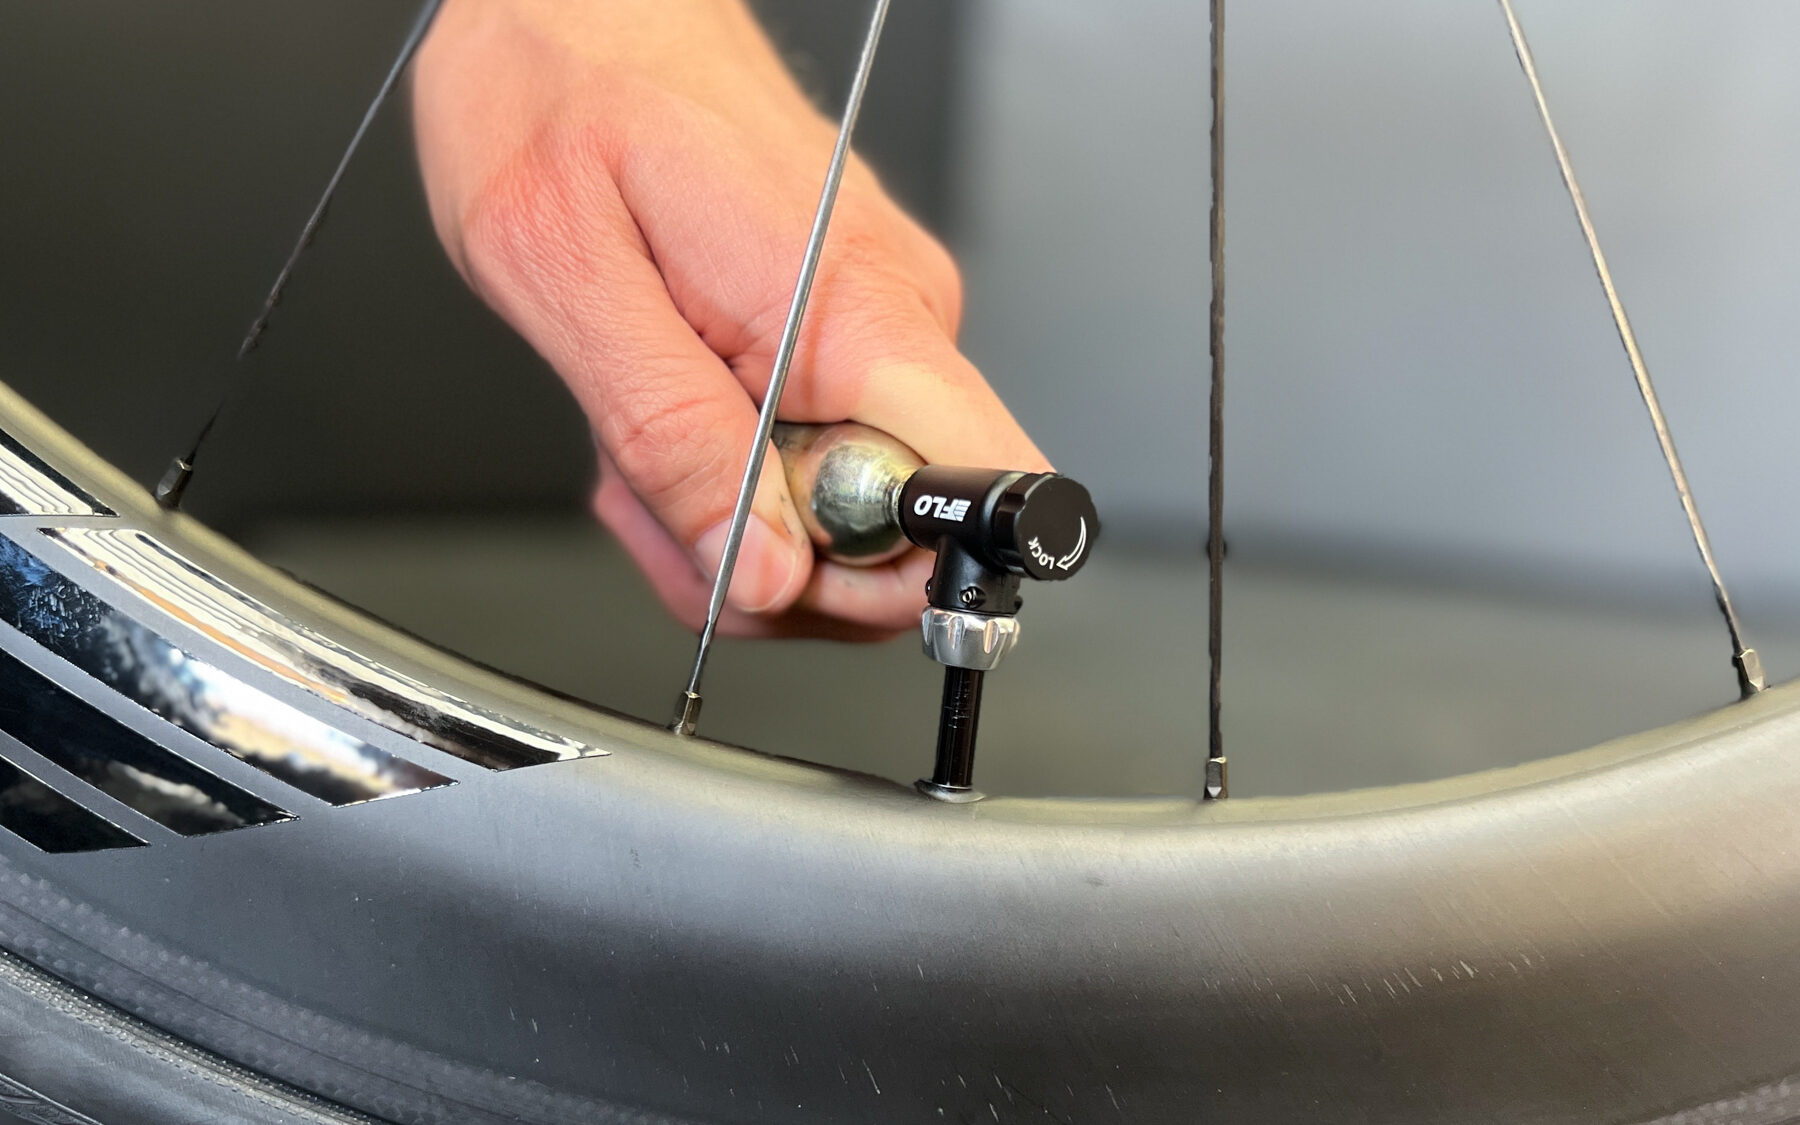
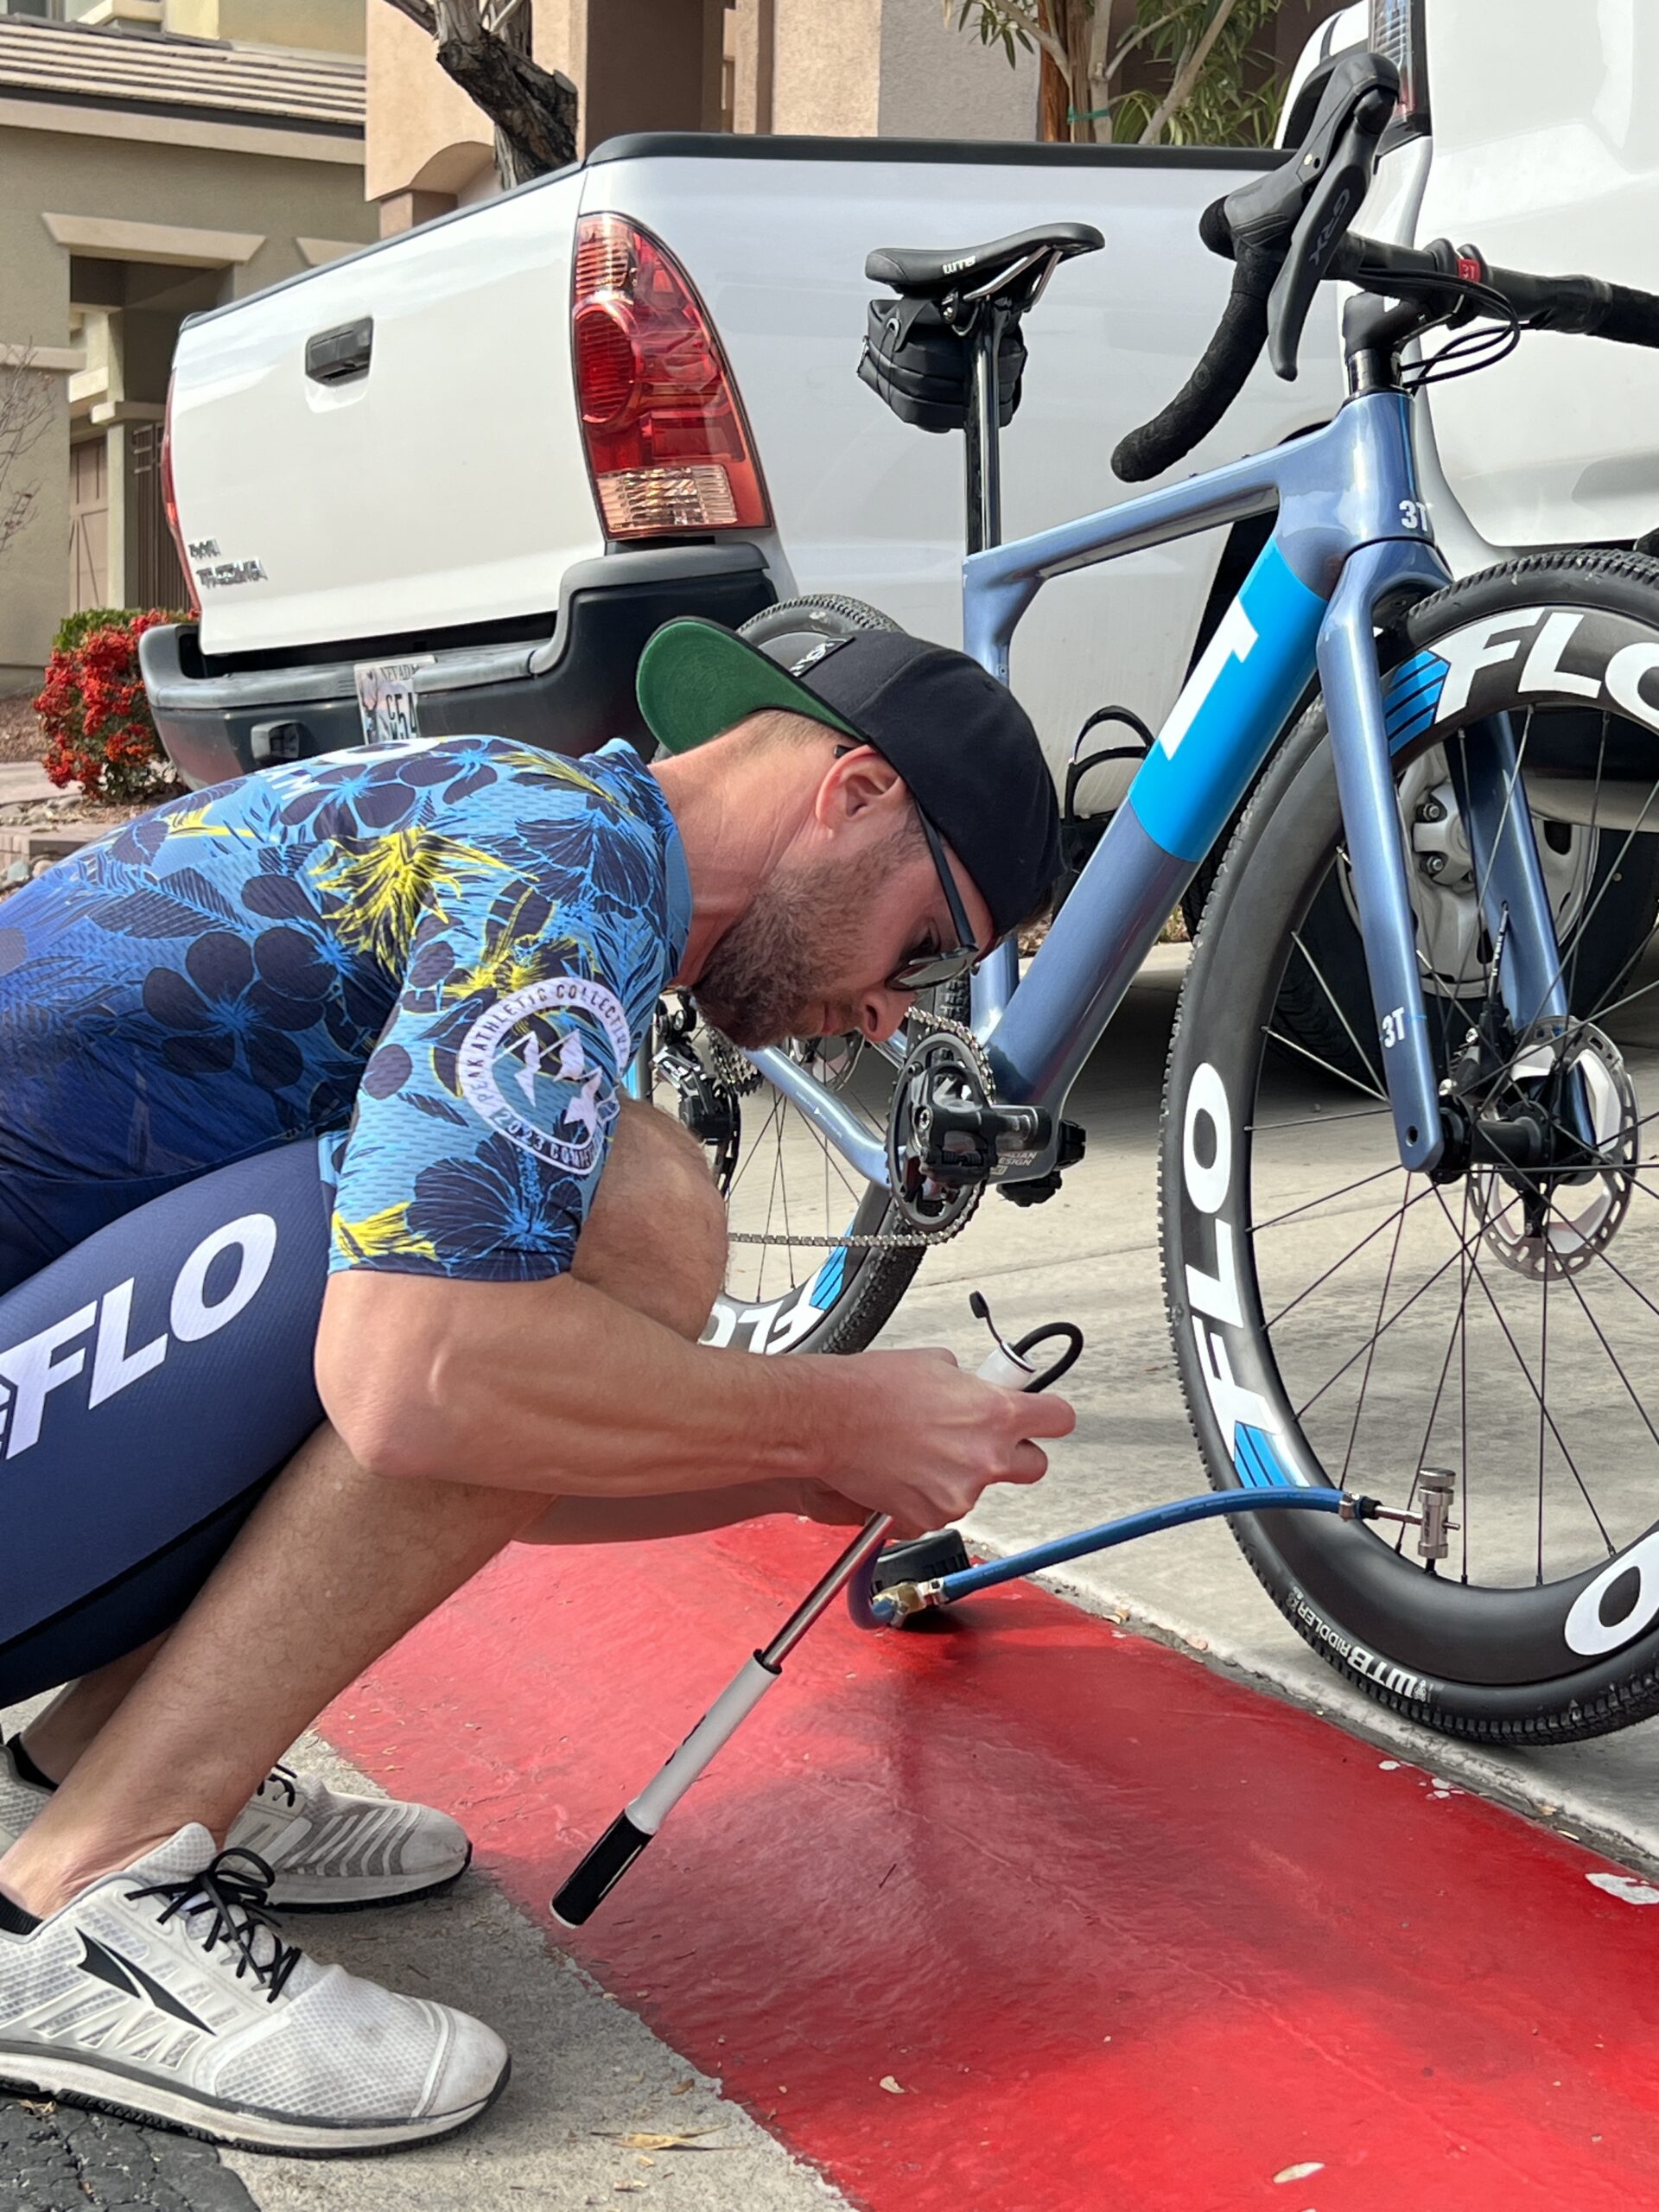
The FLO CO2 Regulator: How To Use a Cycling CO2 Regulator
We recently released the FLO Aid Bag which focuses on bike aid and first aid for cyclists. When developing the tools for the bike aid side, we focused not only on what would most likely be used, but created tools that solved problems. Let’s discuss the FLO CO2 Regulator. The Problem with CO2 Regulators The…
-
How Road Vibration Transfers to the Cyclist
Our latest research is looking at vibration and how it impacts cycling wheels, rolling resistance, and most recently, the cyclist. What know that vibration in a human creates micro tears in the muscles and the body attempts to stabilize itself, both leading to fatigue. Our theory states that if you can manage the vibration through…
-
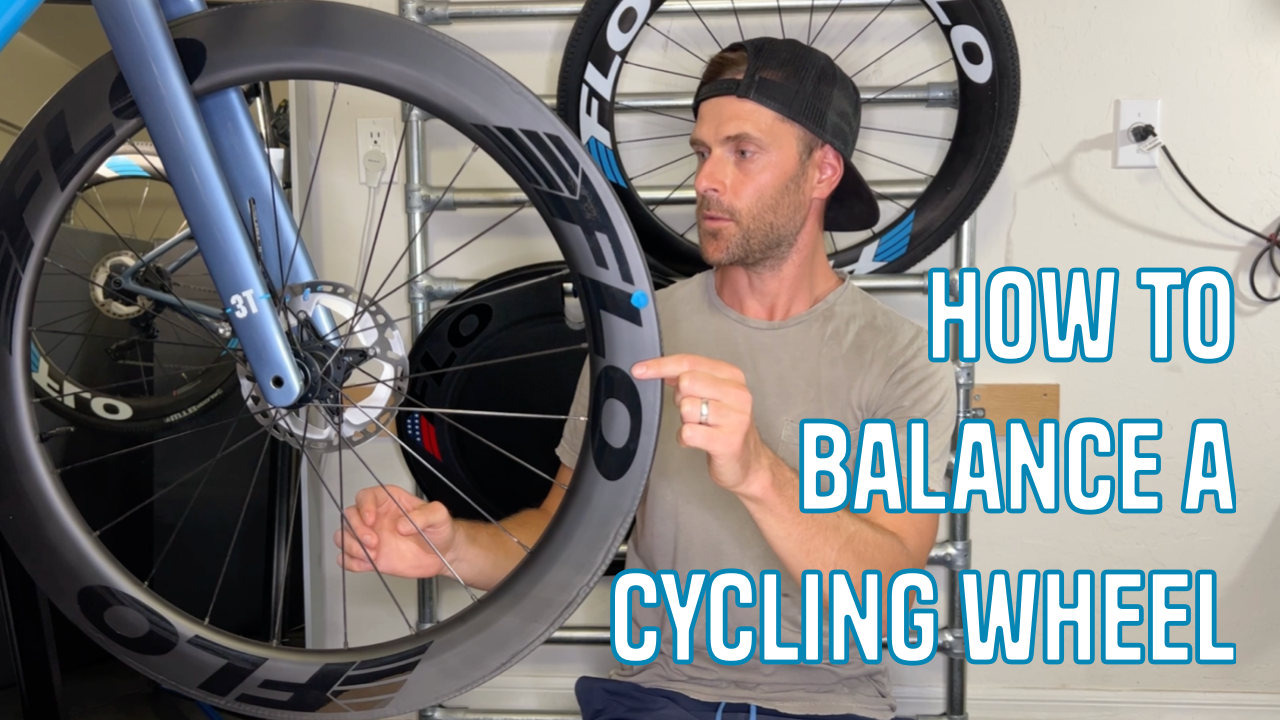
How To Balance a Cycling Wheel
Wheel balance is an important aspect of cycling that affects the overall performance, comfort, and safety of the ride. When a wheel is out of balance you can experience a violent shake at high speed referred to as a “speed wobble” or “death wobble.” Wheel imbalance also reduces stability, wastes watts, and potentially leads to…
-
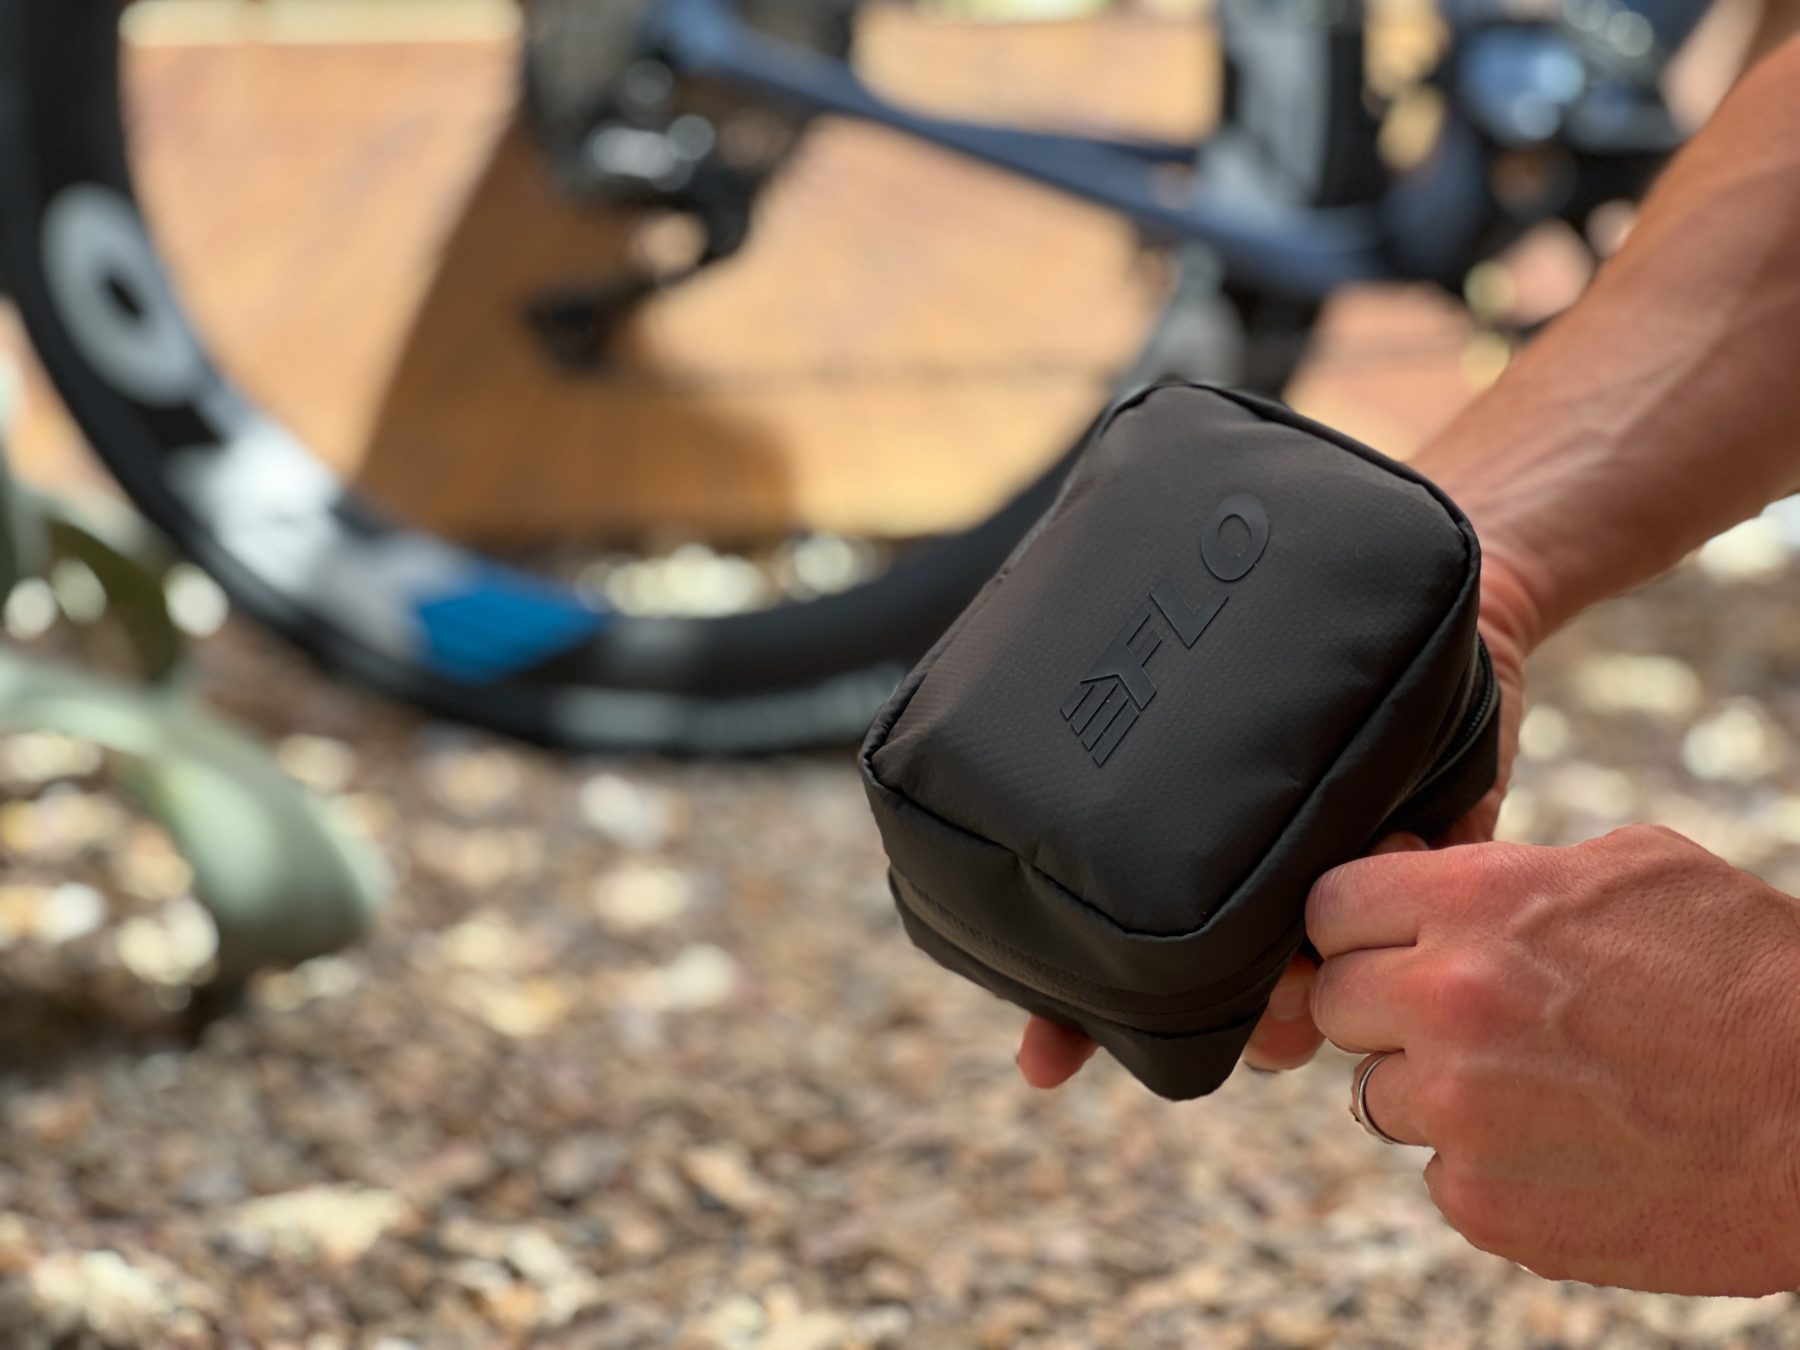
Introducing the FLO Aid Bag
“It’s not if you have an issue on the road, but when.” I received that advice from a fellow cyclist when I first started cycling and unfortunately in cycling, mechanical issues and injuries happen. I’m sure we’ve all been on the side of the road with a flat or waited for the pickup after a…
-
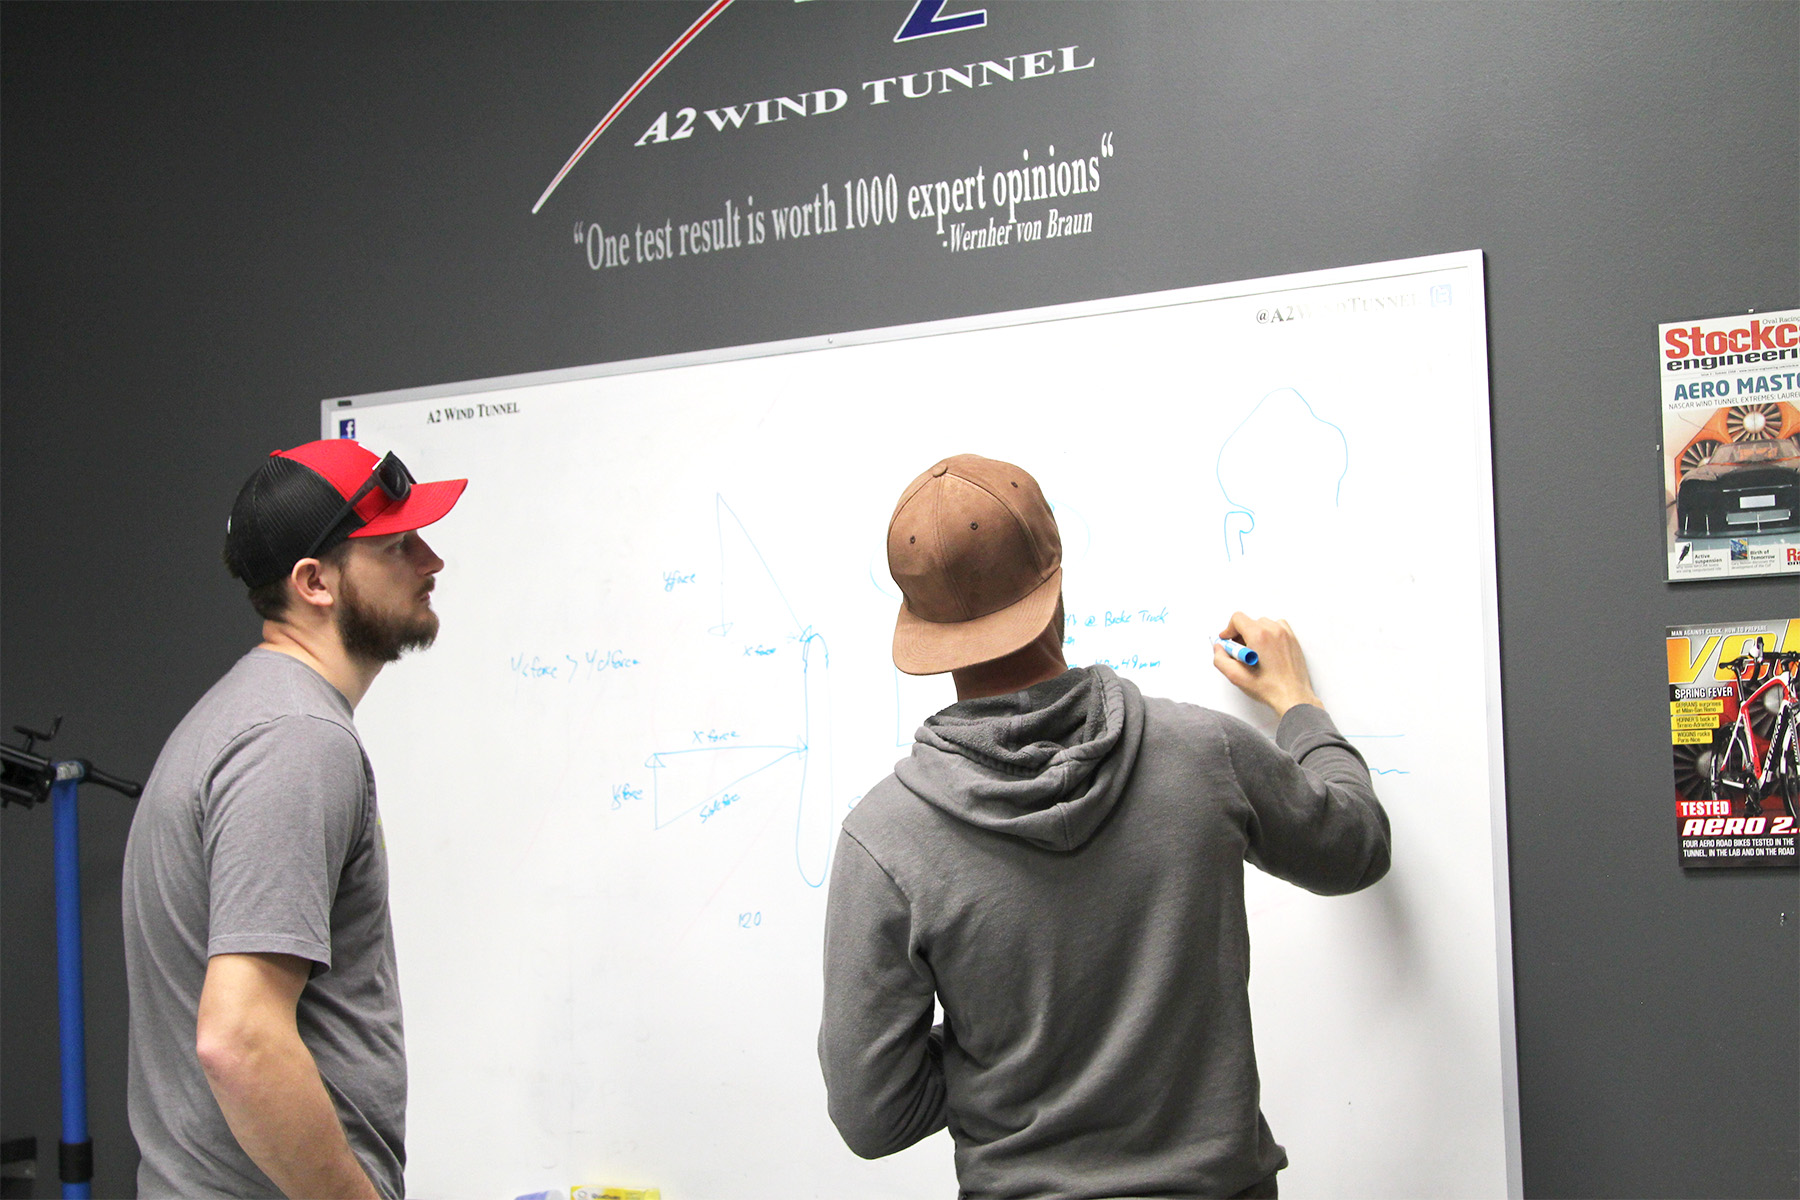
Aerodynamics of Gravel Cycling
In early 2020, we released aerodynamic gravel wheels. During the design, we proved that you could save 11 watts compared to a standard box gravel wheel even with tires as large as 47mm. This is the same savings you have for road/triathlon cycling. I believed it would become accepted that gravel wheels could be aero.…
-
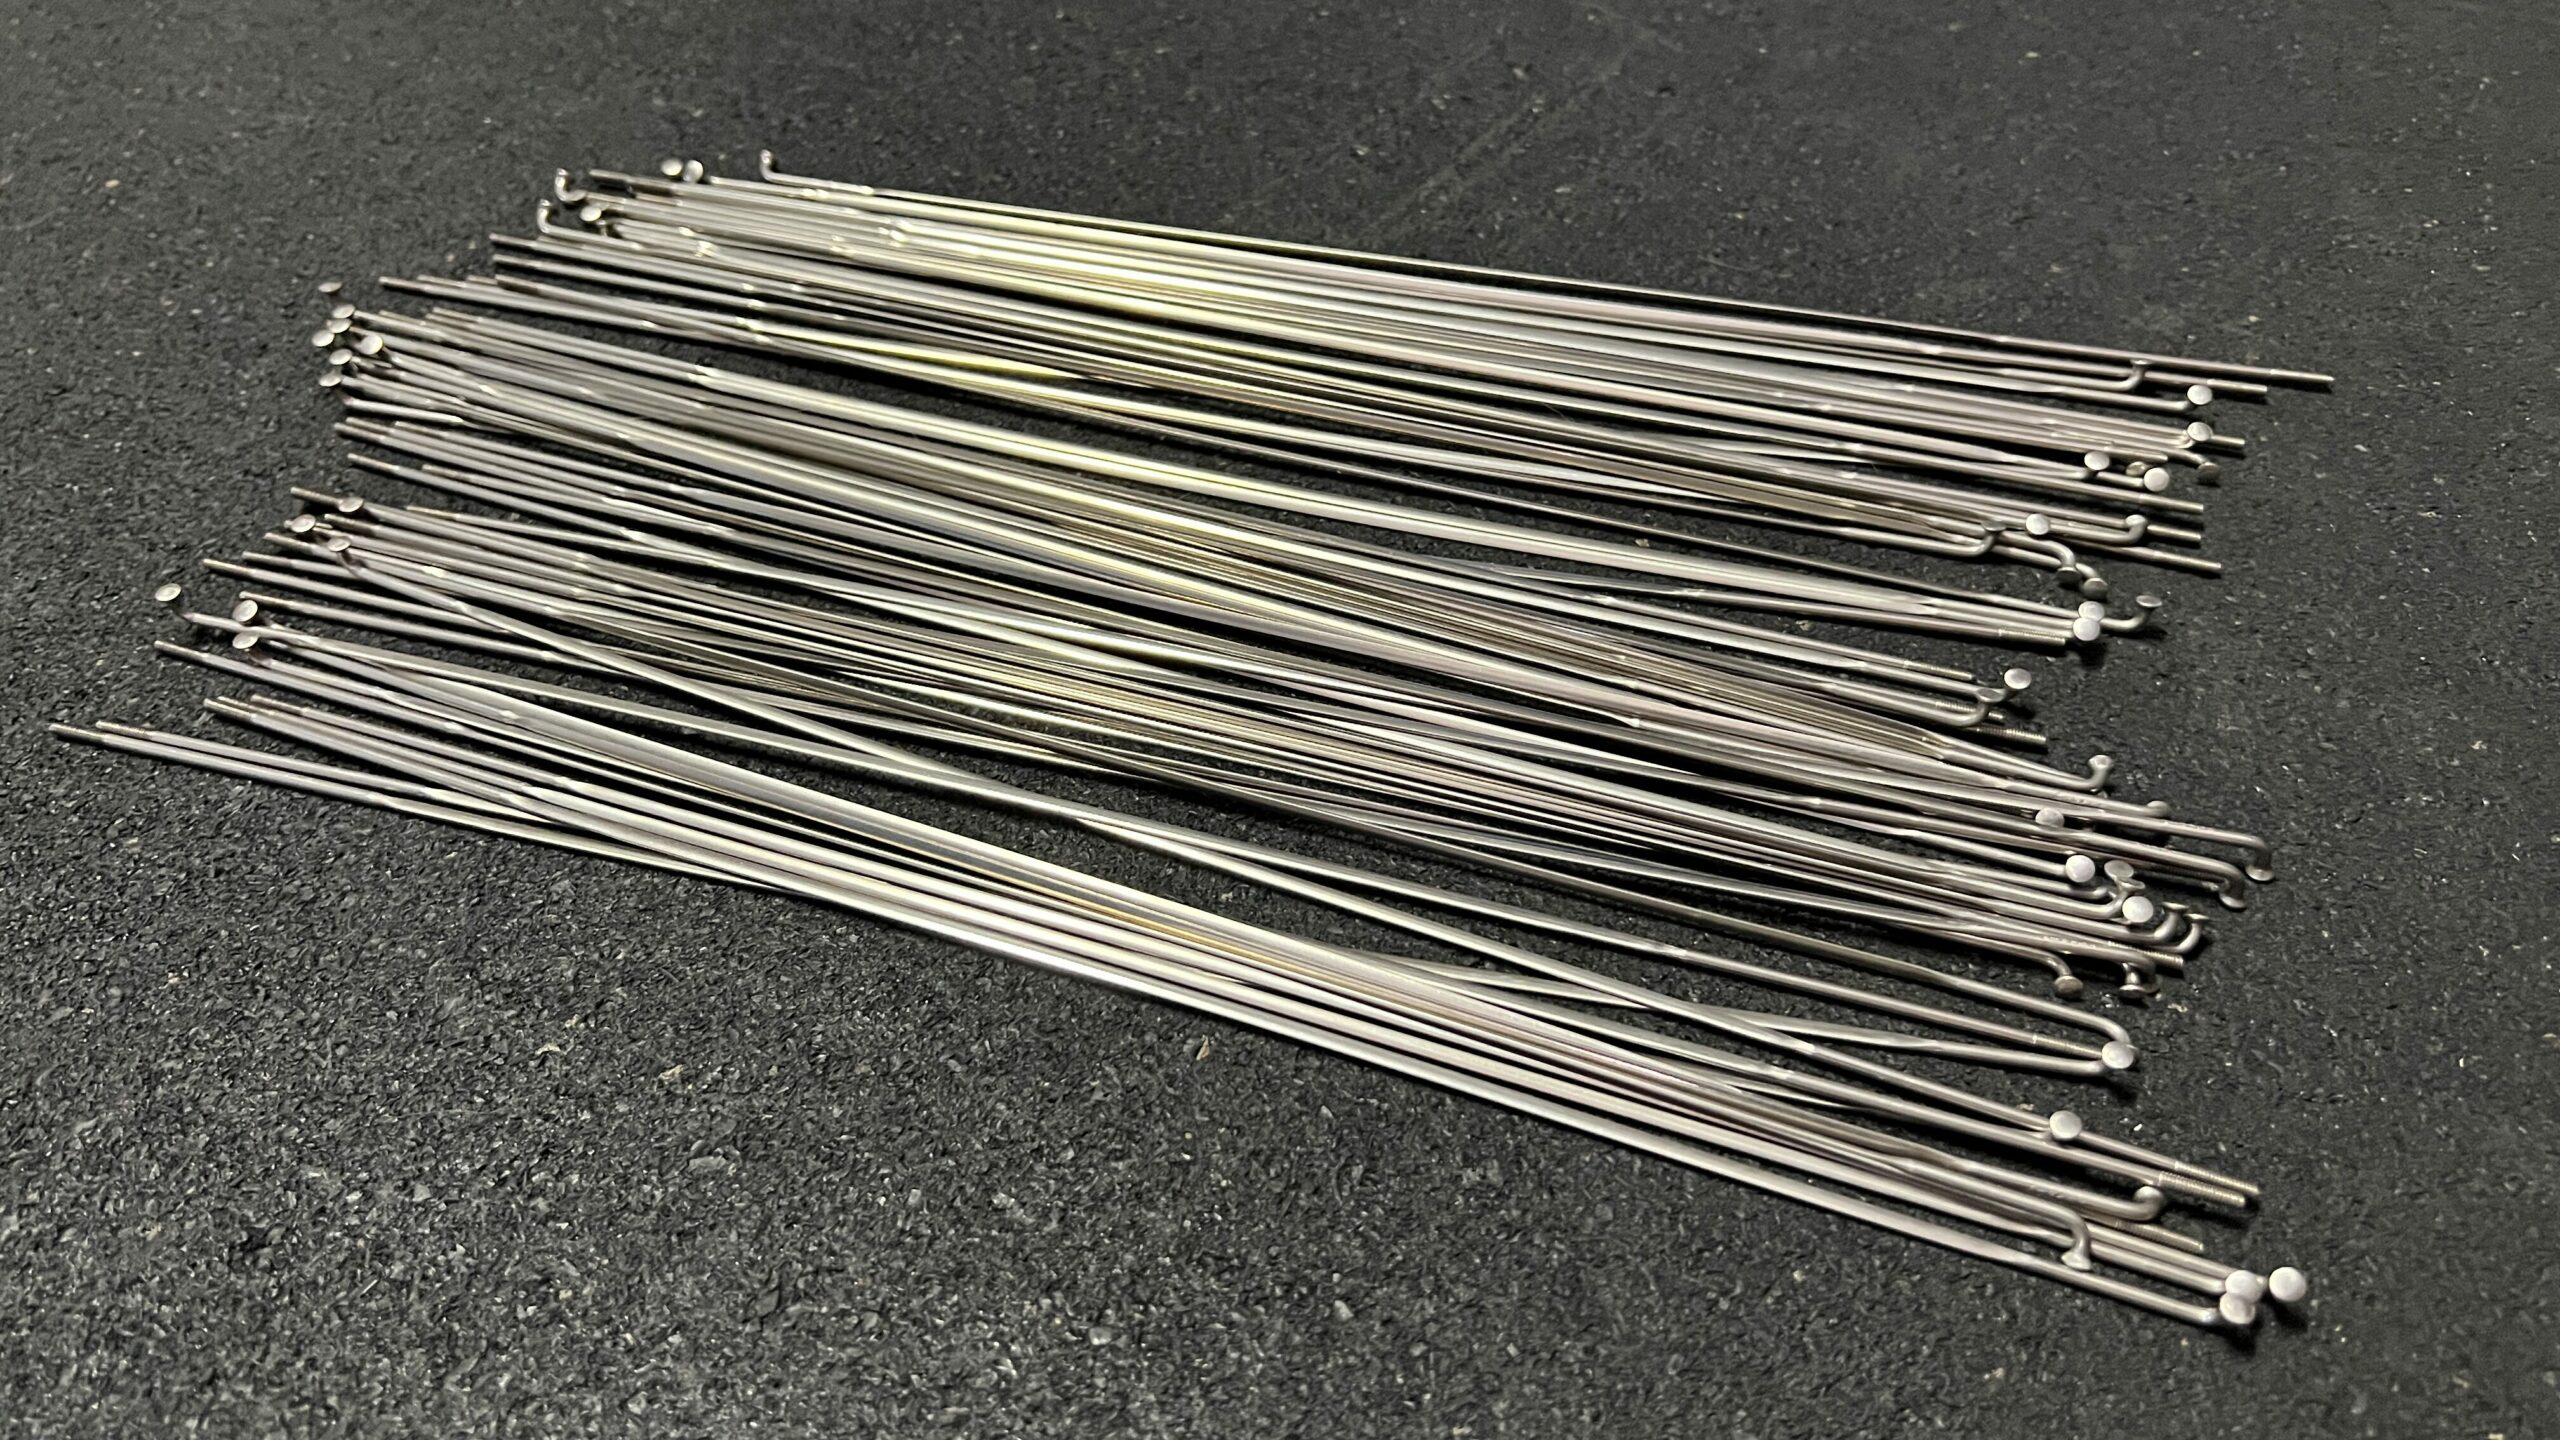
The Secrets Behind The Best Spokes for Cycling Wheels
All FLO Wheels (minus the FLO DISC) use Sapim CX-Ray spokes because of their aerodynamic properties. The FLO DISC uses Sapim Laser Spokes since the spokes do not encounter the air. However, the real magic of a Sapim CX-Ray is its strength and durability which leads to few broken spokes, limited truing, and a long…
-
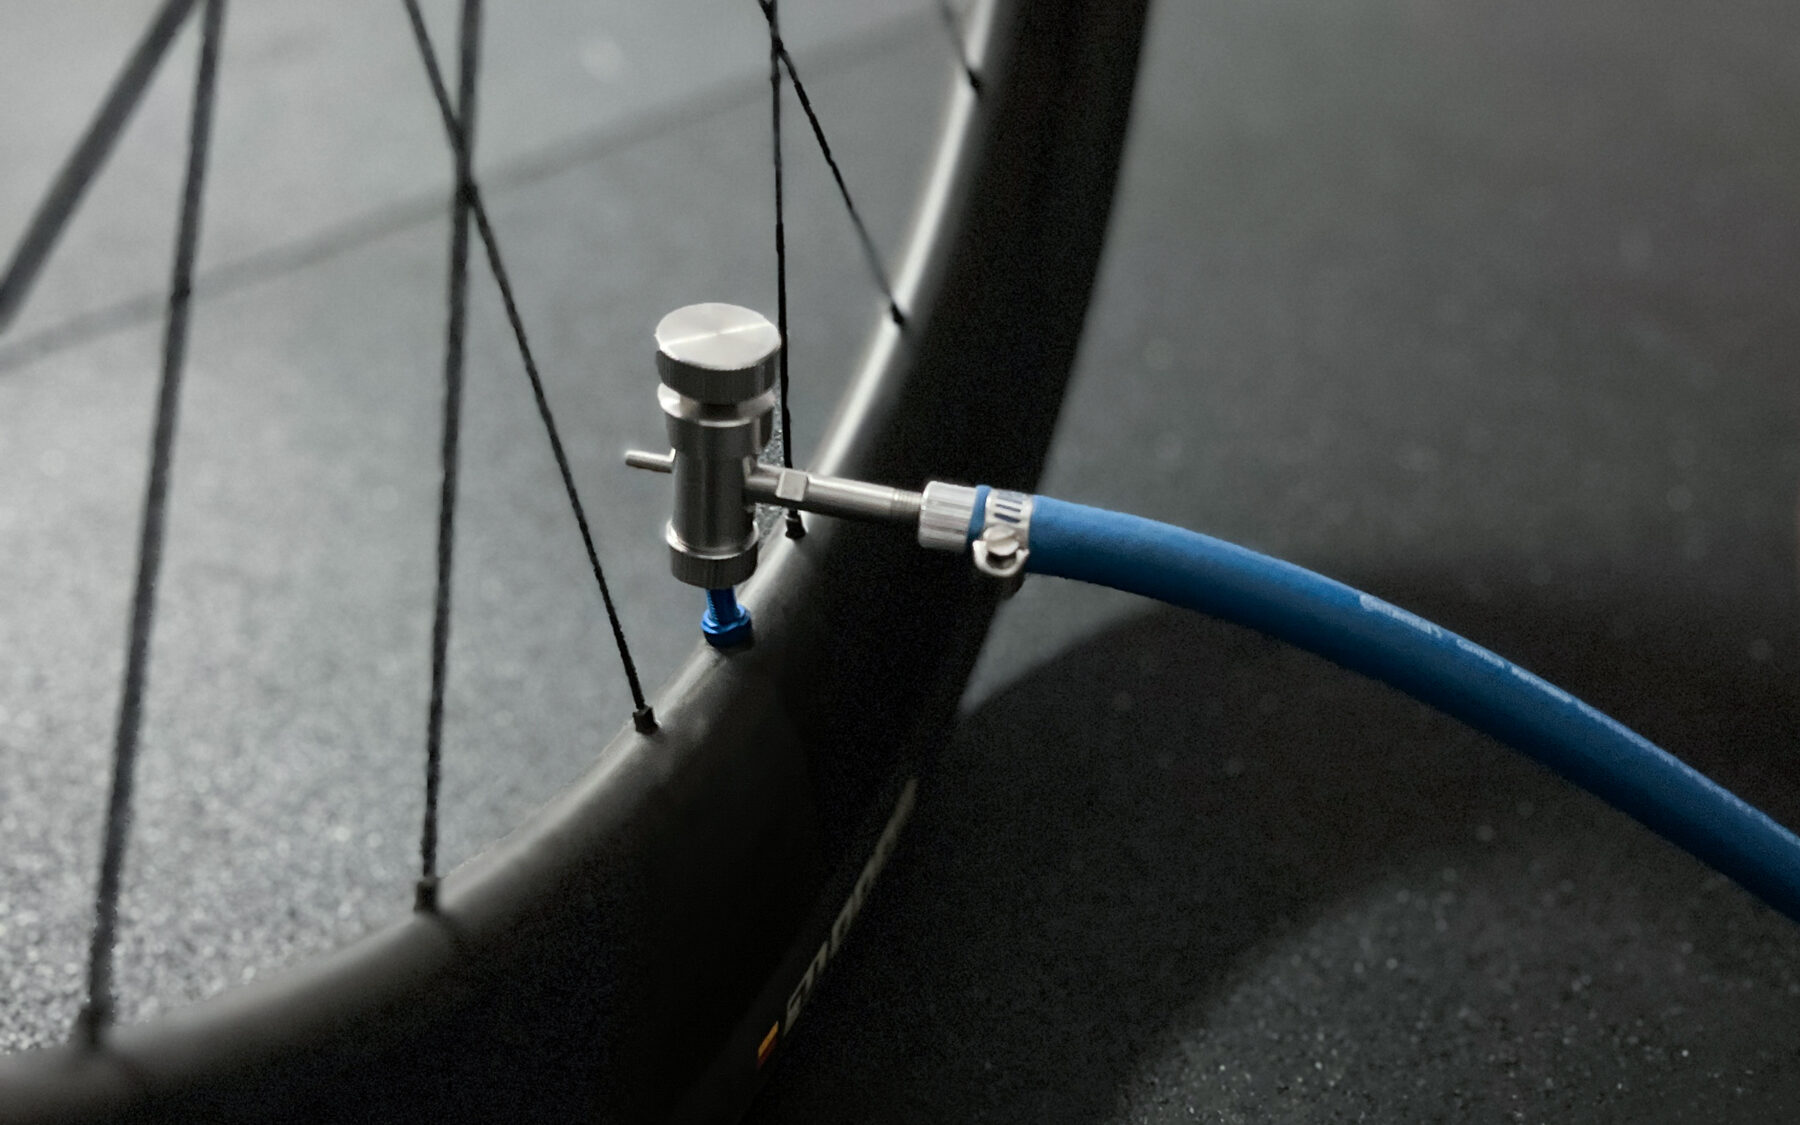
Introducing the FLO Locking Chuck
When we released the FLO Air Gauge, we discussed another new product called the FLO Locking Chuck. When designing the FLO Air Gauge, we looked for a Presta style chuck to meet our needs but we could not find one we liked. The main issues we found were: So, in FLO style, we decided to…
-
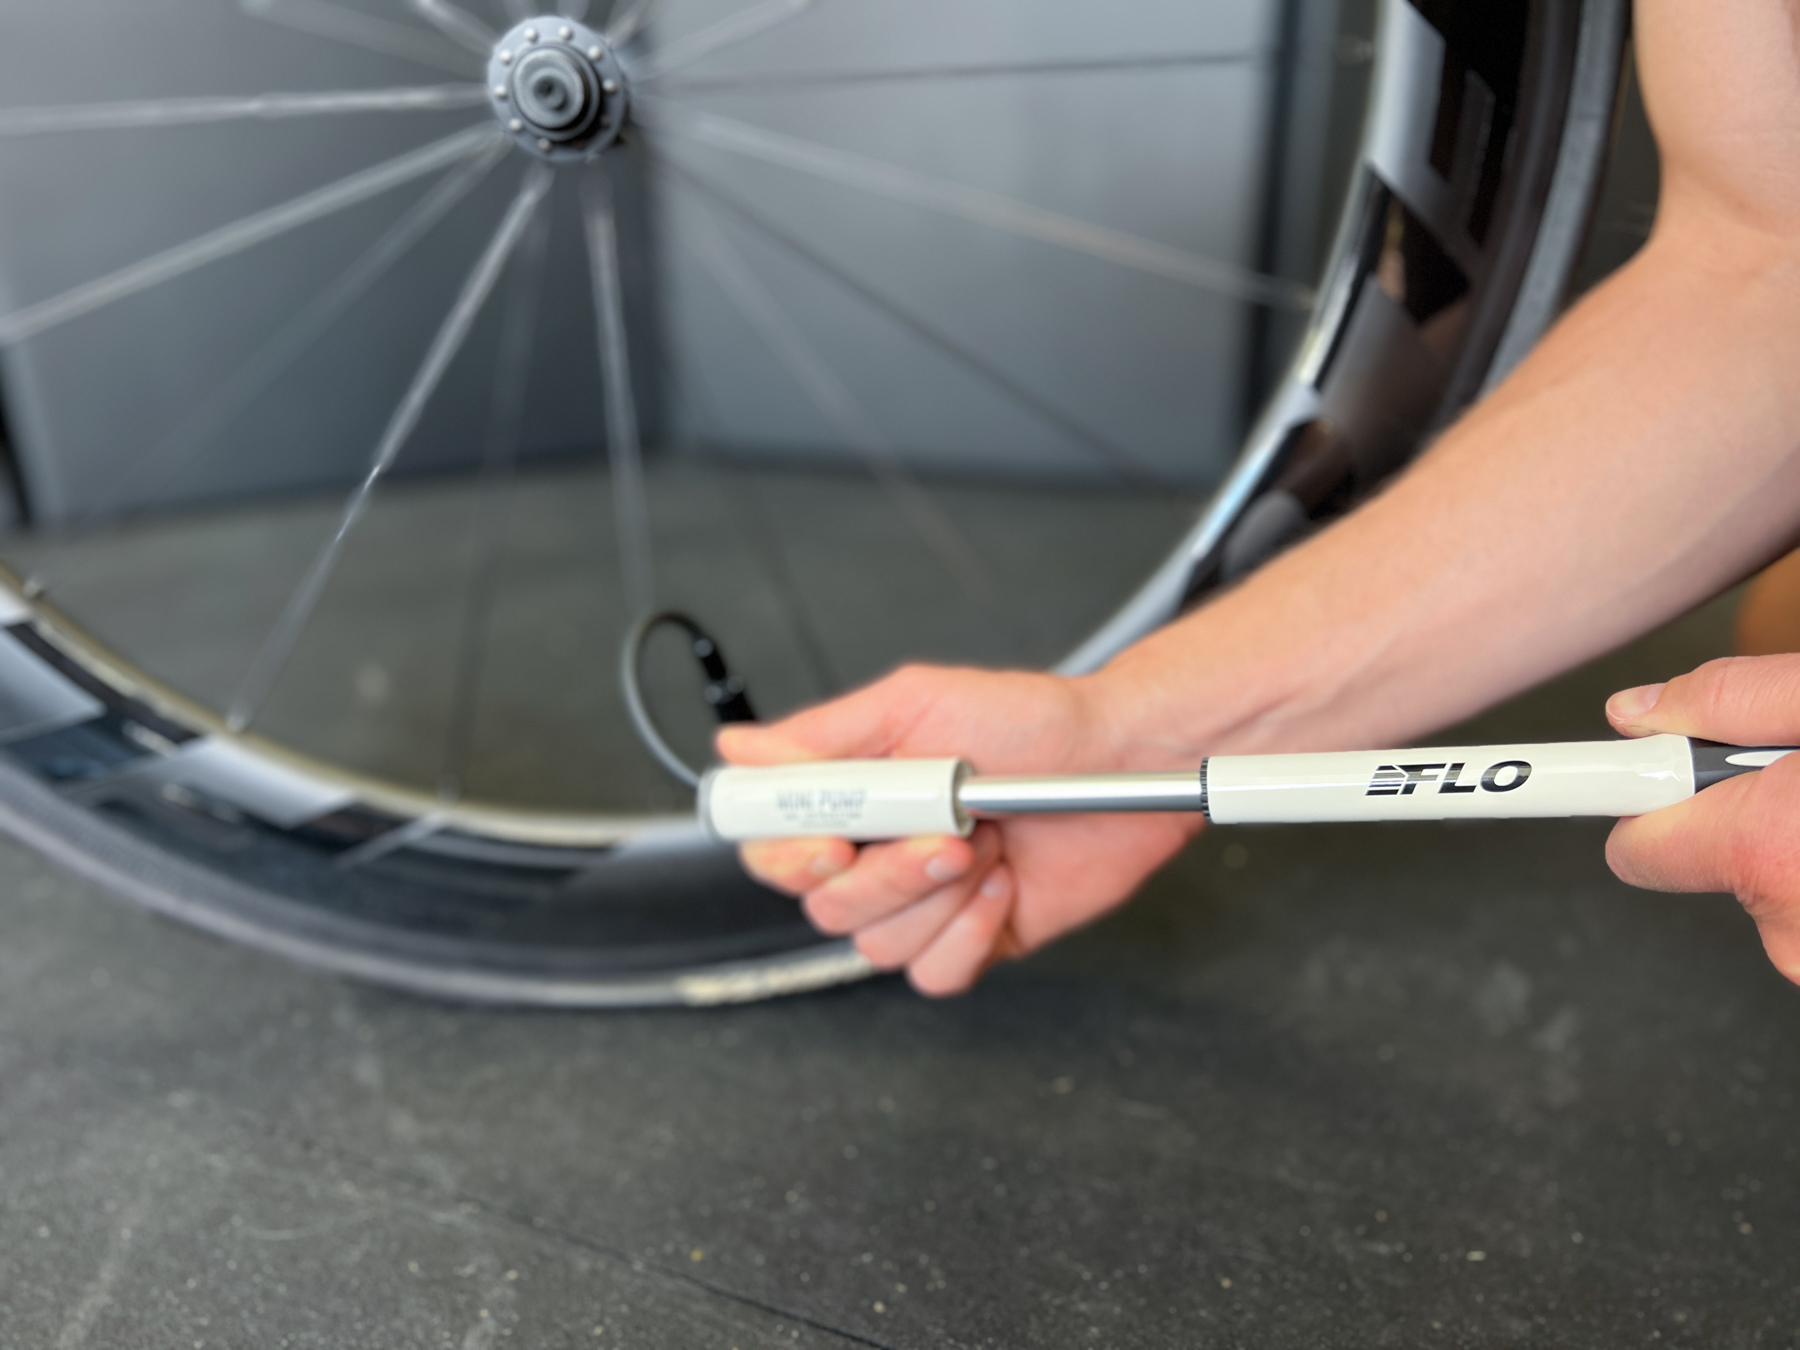
Introducing The FLO Mini Pump
With our recent release of the FLO Air Gauge, we discussed a new concept called modular inflation. Modular inflation stems from the ability to use the FLO Air Gauge with any pump. Naturally, we felt a mini pump was an excellent addition to FLO’s line of inflation products. The beauty of adding the FLO Mini…
-

IM Hawaii & IM Kona Wheel, Tire, & Tire Pressure
I recently visited The Big Island of Hawaii and reviewed the bike course for Ironman Hawaii 70.3 and Ironman Kona. I’ve spent time studying the course and have been fortunate to attend the World Championship race seven times. Over the years I’ve learned a lot and hope this article will help prepare you for your…
-
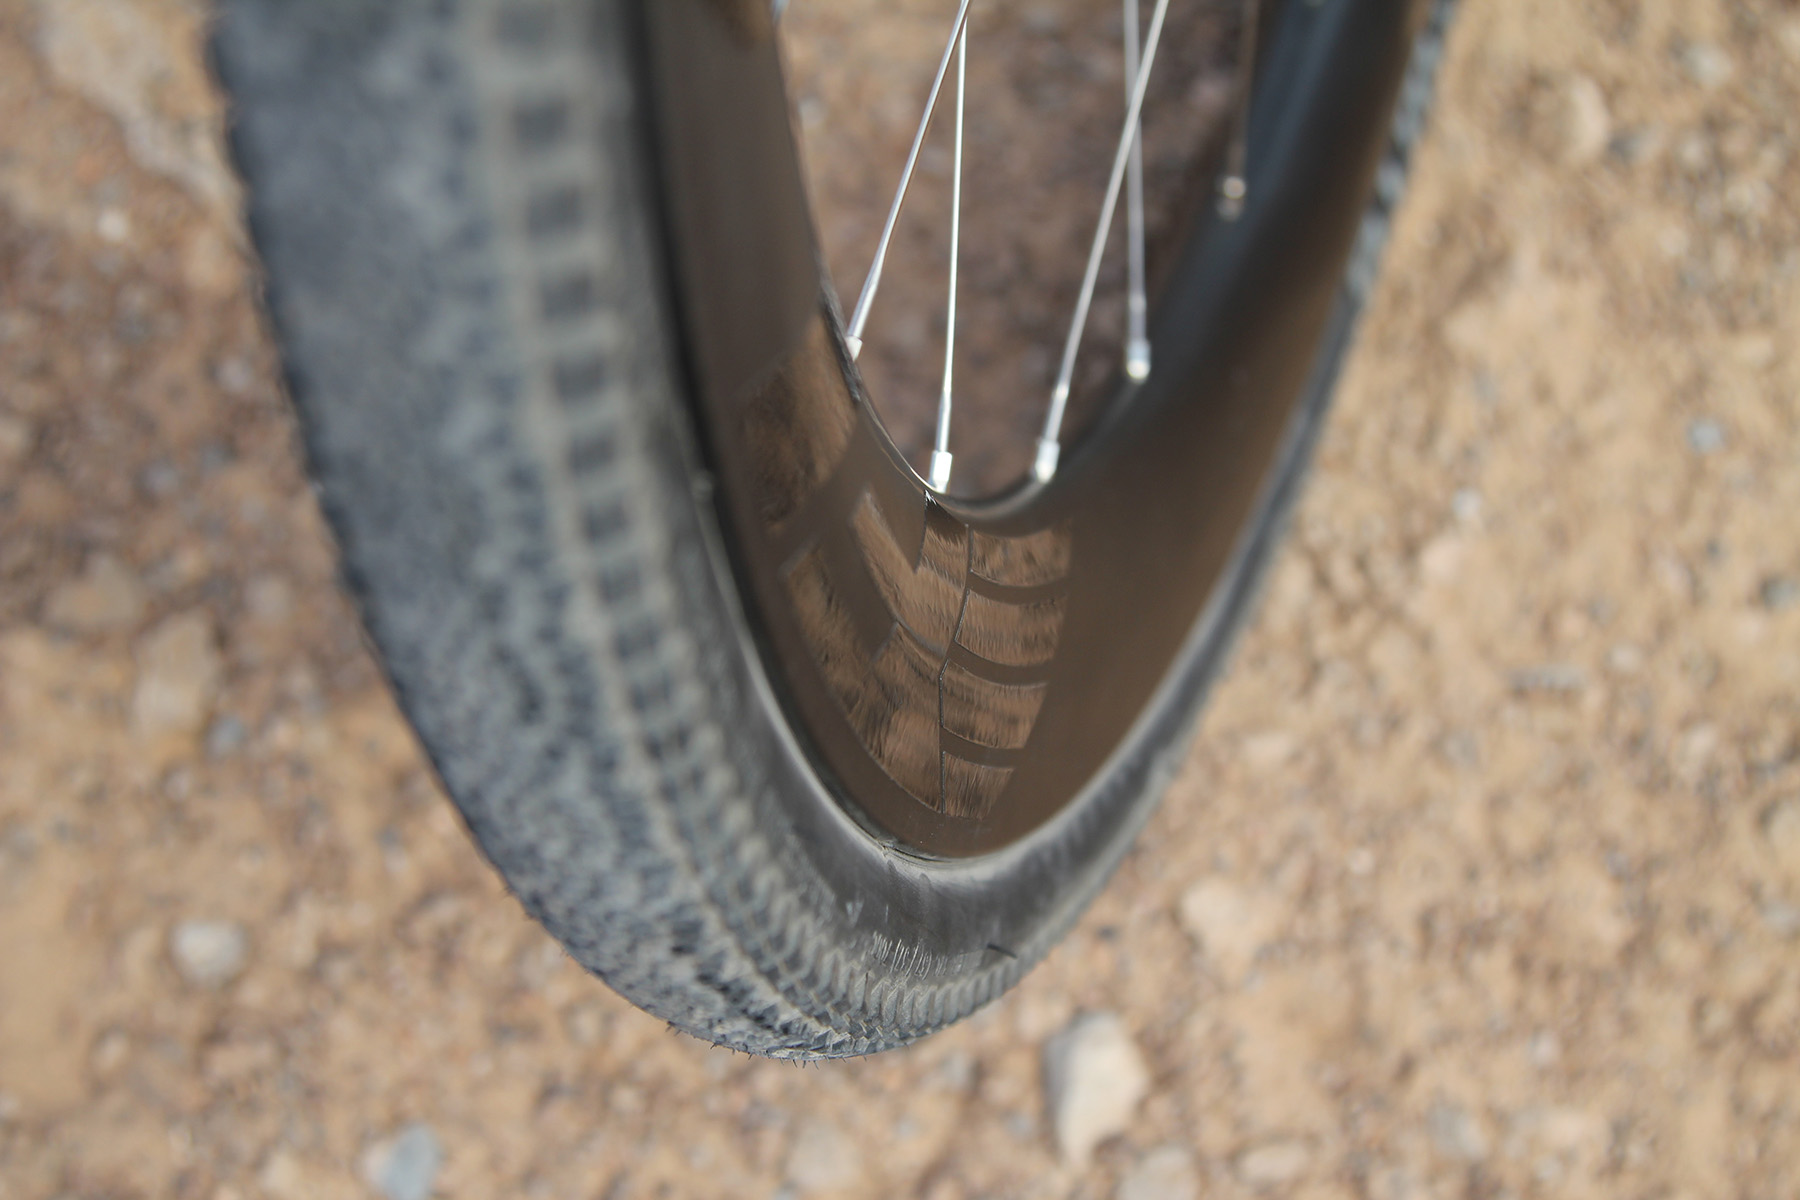
Using Bike Tires as Shocks on Gravel Terrain and Rough Roads
Mountain bikes have shocks to help absorb obstacles on the trail. Roads do not usually contain those obstacles so no shocks are needed on road bikes. What about gravel? Cycling shocks were heavily debated for several years through the “Frankenbike” phase and the bikes people rode in the early gravel days were entertaining. Ultimately, the…